Data Science Essentials with Python Final Exam Answers
Data Science Essentials with Python Final Exam Answers
The Data Science Essentials with Python Final Exam Answers provides a comprehensive collection of verified solutions designed to help learners successfully prepare for their final assessment. This resource covers key concepts such as data analysis, data visualization, statistical methods, and Python programming techniques commonly tested in the exam. Whether you are reviewing core topics or checking your understanding before submission, these answers serve as a reliable guide to reinforce your knowledge and boost your confidence for achieving a high score.
1. The following code was run:
df[[‘o1’, ‘o2’, ‘o3’, ‘o4’]] = df[‘ip’].str.split(‘.’, expand=True)
After the split, what is the datatype of columns o1 through o4?
- float
- string
- integer
- datetime
2. Which three of the following Pro Tips were followed to create the graph? (Choose 3)
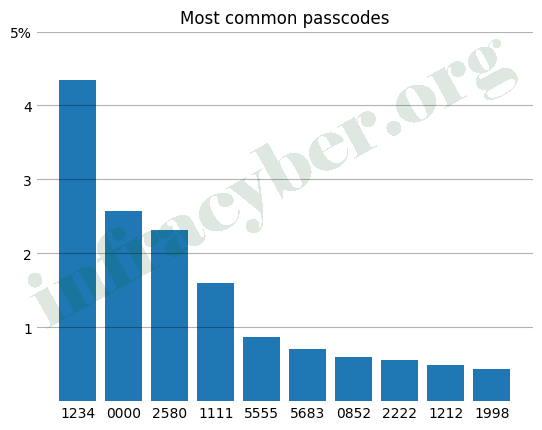
- Swap ticks and spines for faded grid lines.
- Use horizontal bars.
- Change marker transparency.
- Minimize rotated text.
- Give the bars order.
3. The graph shows the relationship between temperature and the number of cricket chirps per second. Which two of the following statements are most likely true? (choose 2)
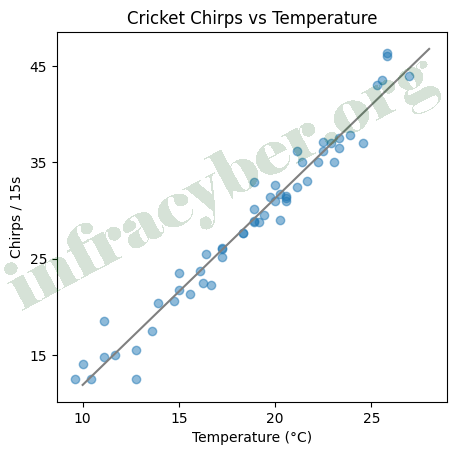
- The goodness of fit value is 0.04
- As temperature increases, crickets chirp less frequently
- The goodness of fit value is 0.96
- As temperature increases, crickets chirp more frequently
4. The graph shows the number of Atlantic hurricanes per year. The first operational weather satellite went into orbit in 1966. Which statement below is best supported by the data?
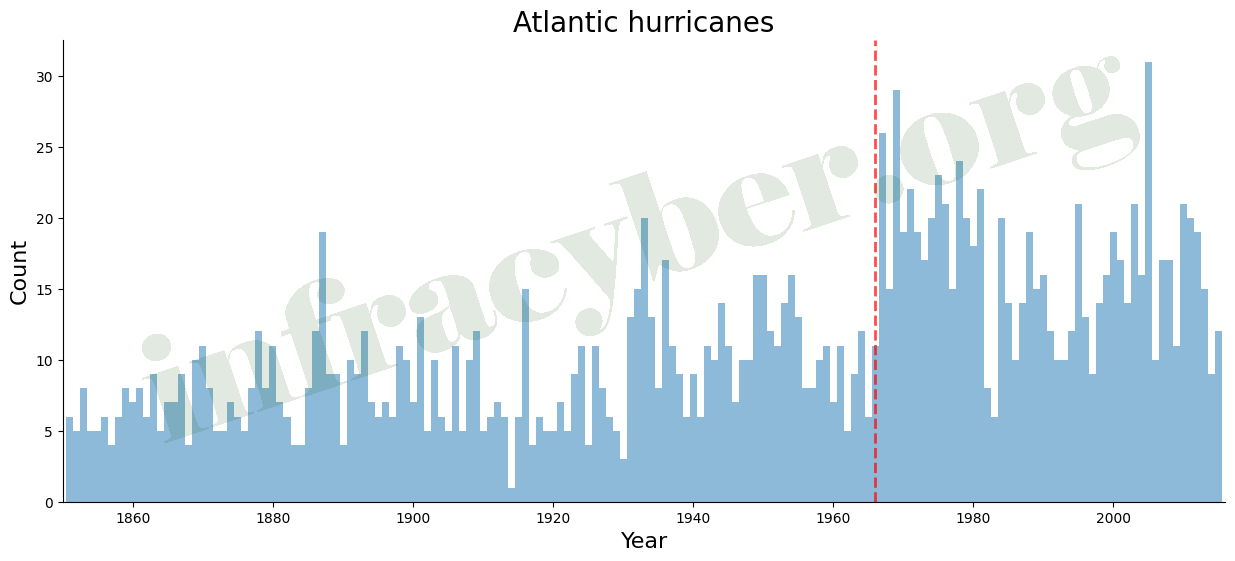
- Weather satellites improved the ability to detect hurricanes.
- More hurricanes reached land after 1966.
- Weather satellites caused an increase in the number of hurricanes.
- Hurricanes became stronger after 1966.
5. Which code would calculate the percentage of students that got an ‘A’ in each class?
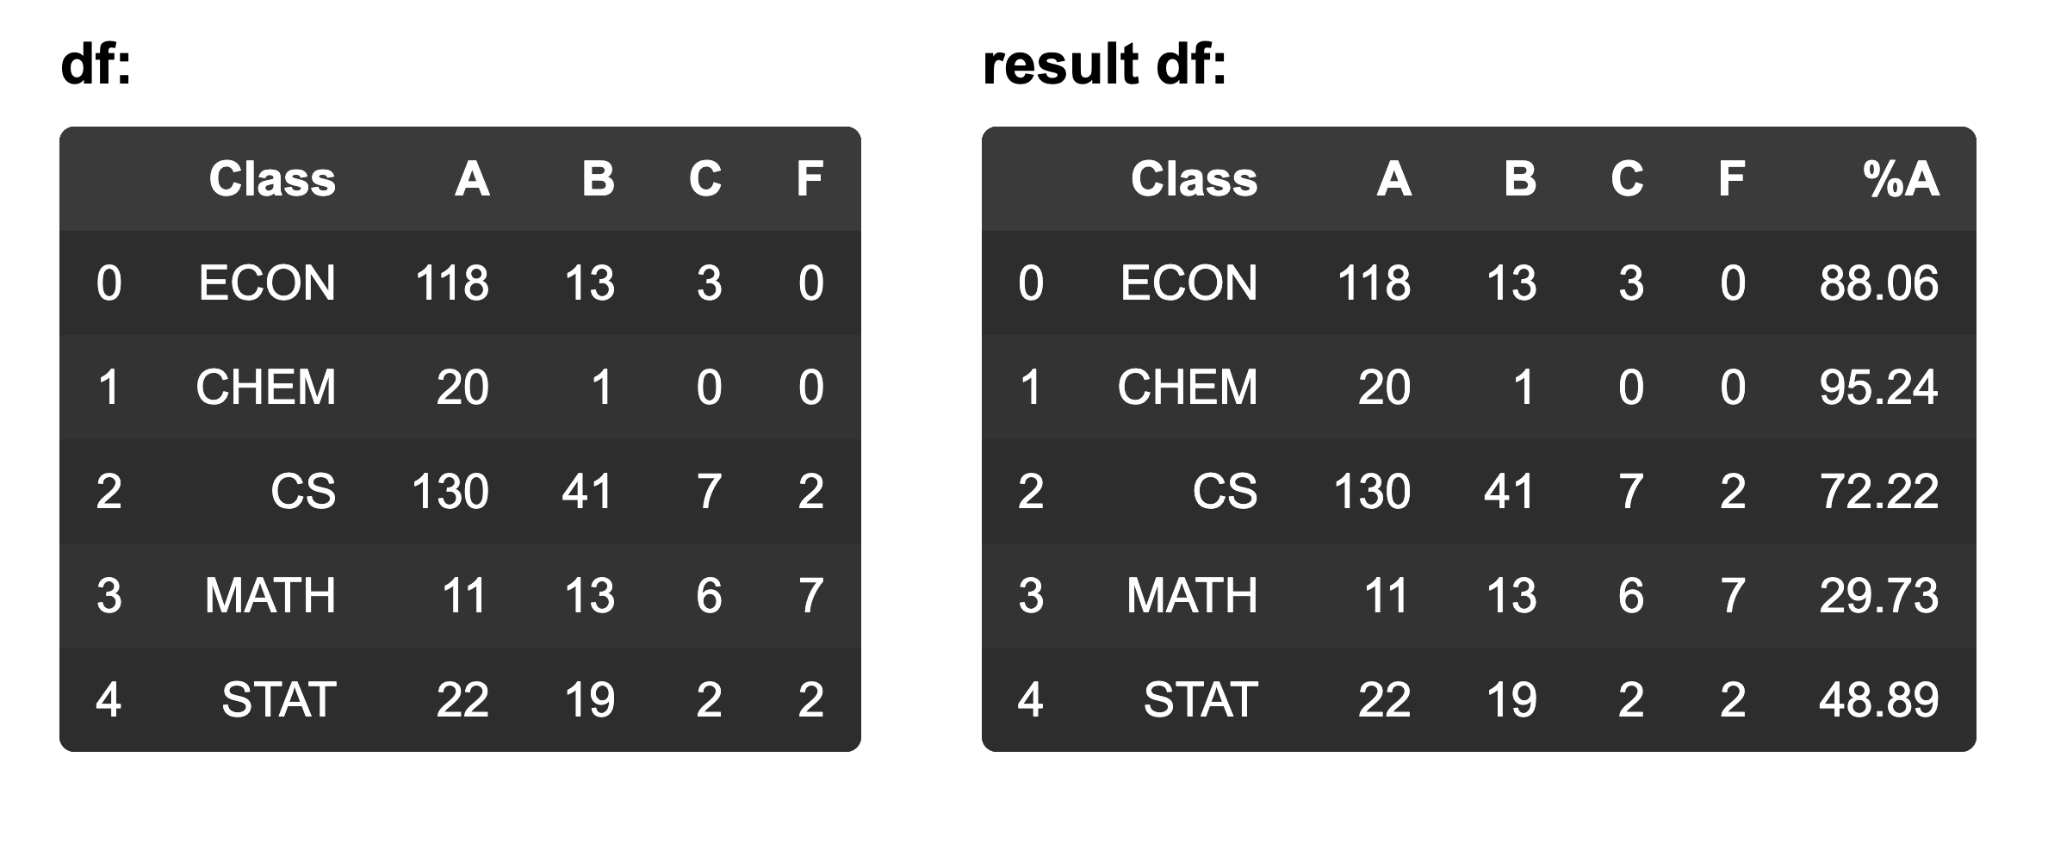
- df[‘%A’] = df.query(‘A / (A + B + C + F) * 100’).round(2)
- df[‘%A’] = df.eval(‘A / (A + B + C + F) * 100’).round(2)
- df[‘%A’] = df.query(‘A / A + B + C + F * 100’).round(2)
- df[‘%A’] = df.eval(‘A / A + B + C + F * 100’).round(2)
6. There are 8 species of baobabs in the world (genus Adansonia). Which code would return the height of the tallest baobab species for each region as a dataframe?
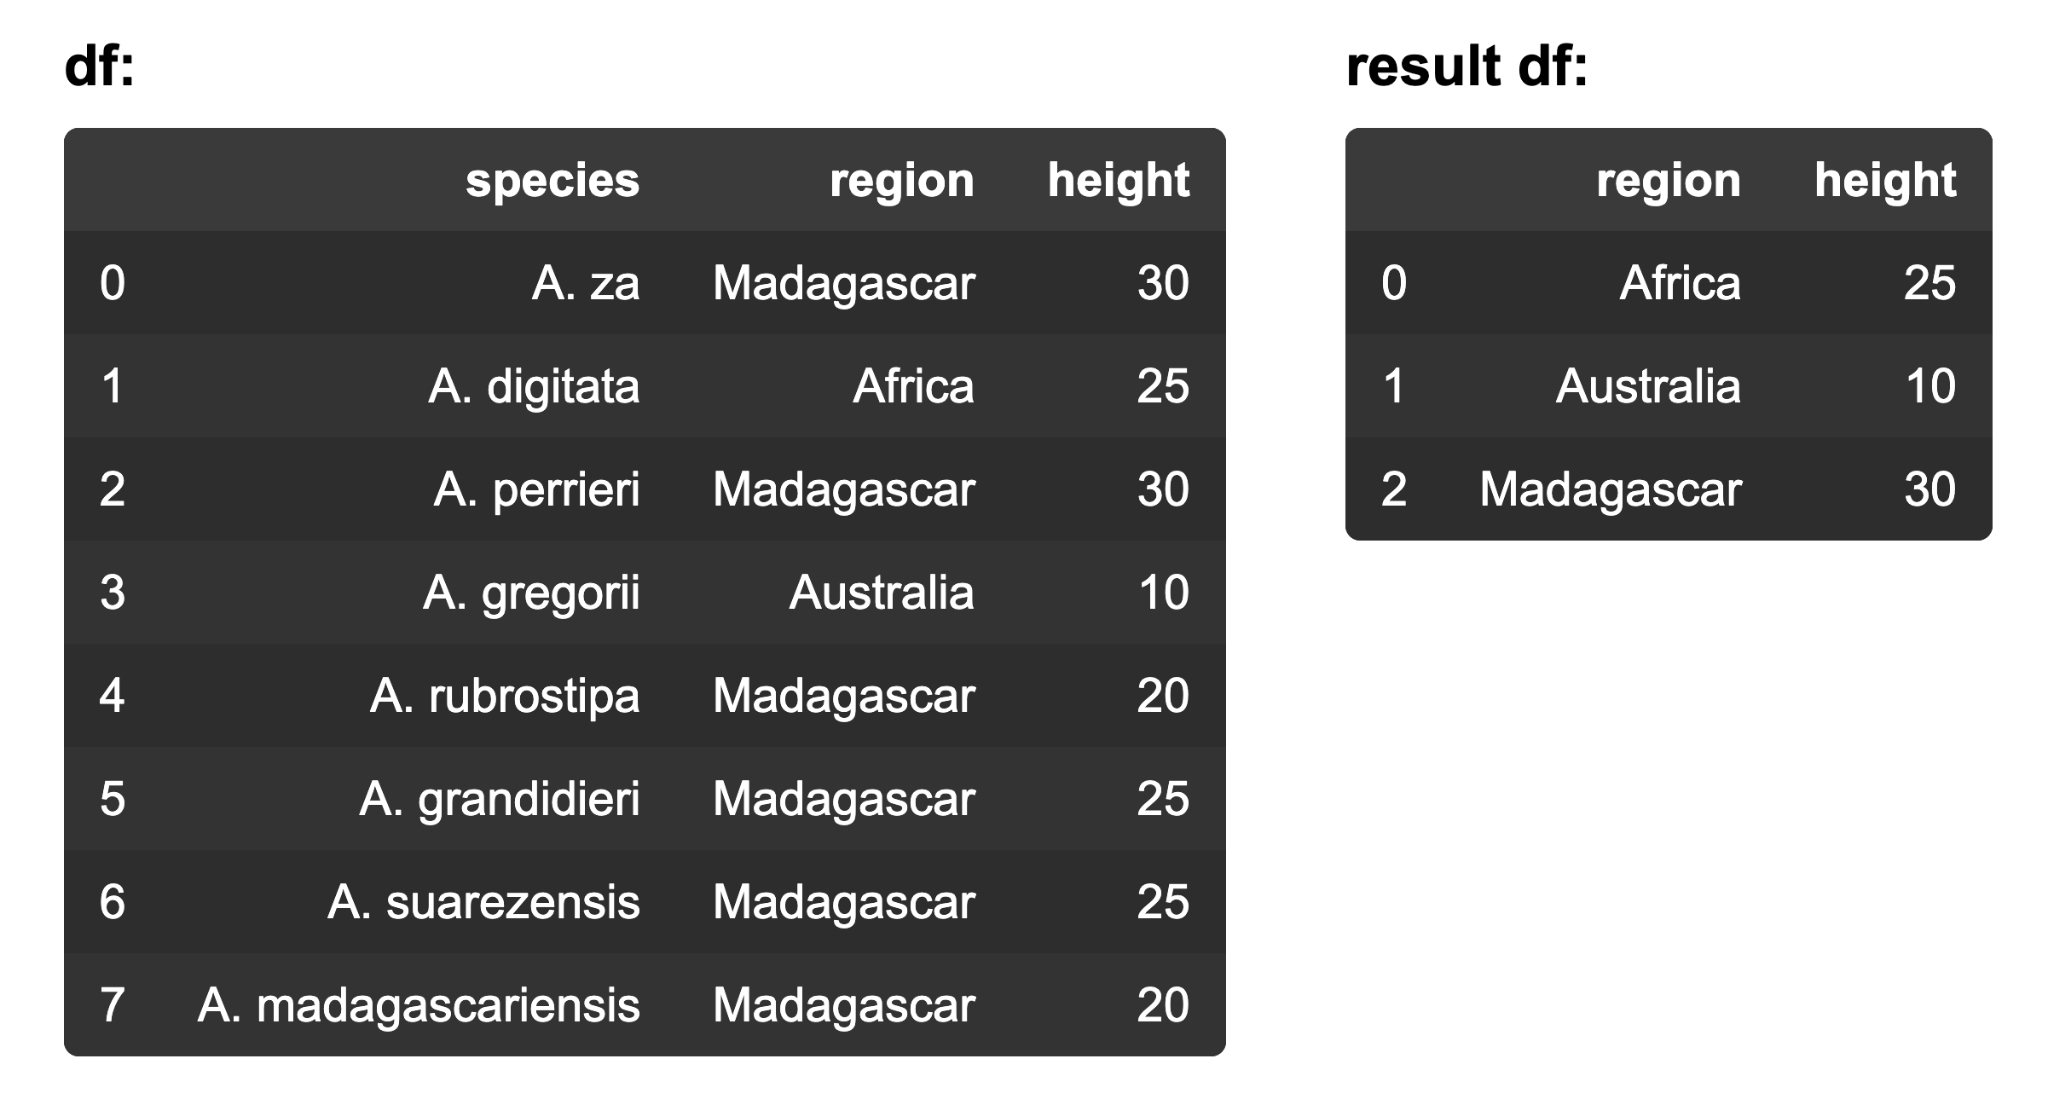
- df.groupby(‘height’)[‘region’].max()
- df.groupby(‘region’)[‘height’].max()
- df.groupby(‘height’)[‘region’].max().reset_index()
- df.groupby(‘region’)[‘height’].max().reset_index()
7. The dataframe is from ‘baobab-tree-pollinators.csv’. Which code would calculate the percentage of baobab trees that are pollinated by hawkmoths?
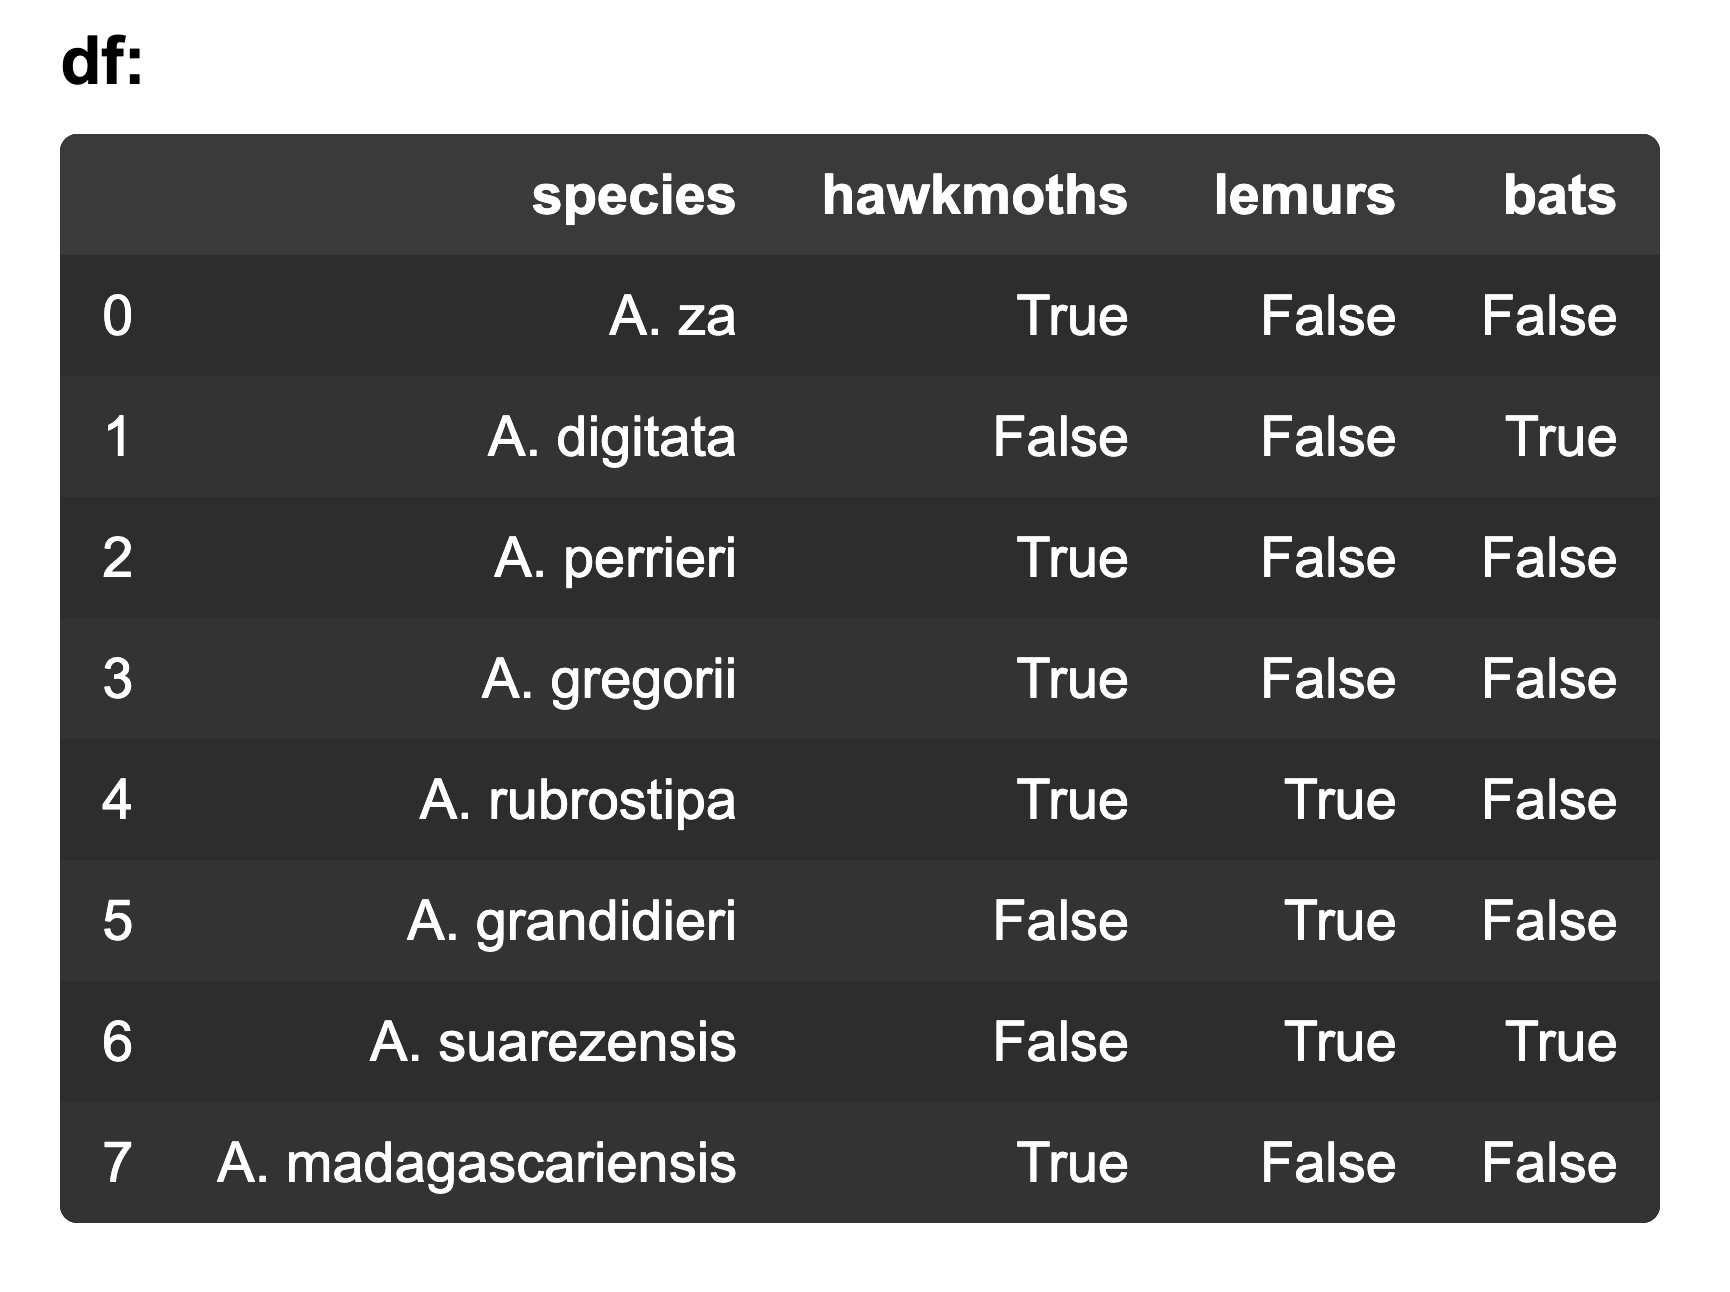
- df[‘hawkmoths’].mean() * 100
- df[‘hawkmoths’].max() * 100
- df[‘hawkmoths’].sum() * 100
- df[‘hawkmoths’].median() * 100
8. Which code performs the merge as shown below?
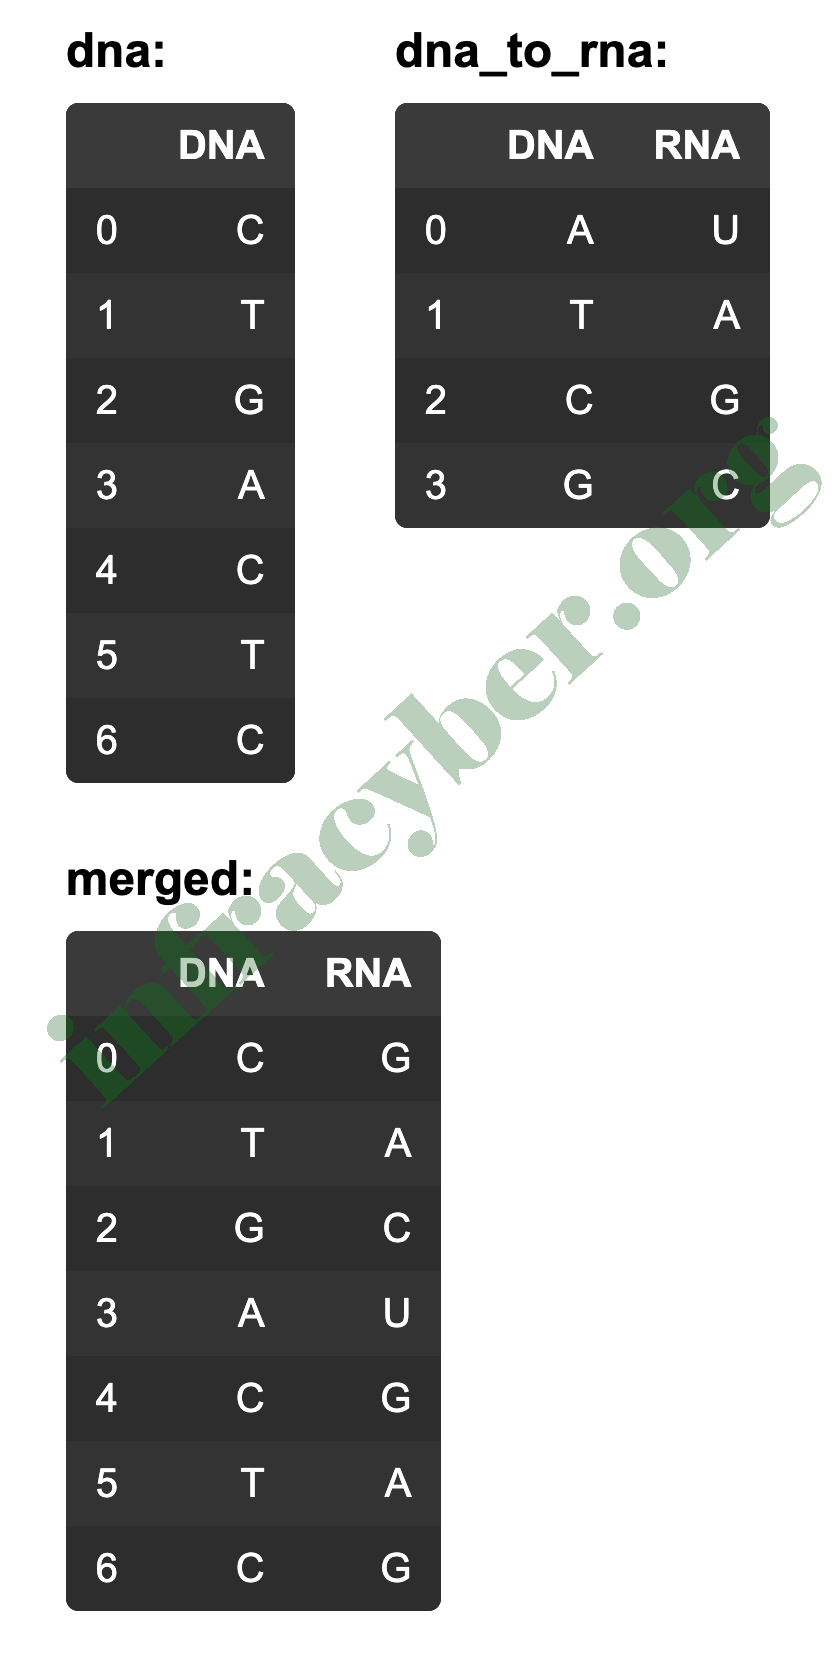
- dna_to_rna.merge(dna, on=’DNA’, how=’left’)
- dna.merge(dna_to_rna, on=’DNA’, how=’left’)
- dna.merge(dna_to_rna, on=’DNA’)
- dna_to_rna.merge(dna, on=’DNA’)
9. The dataframe is from ‘nuts-nutrition.csv’. What are two ways to get the new, smaller dataframe? (choose 2)
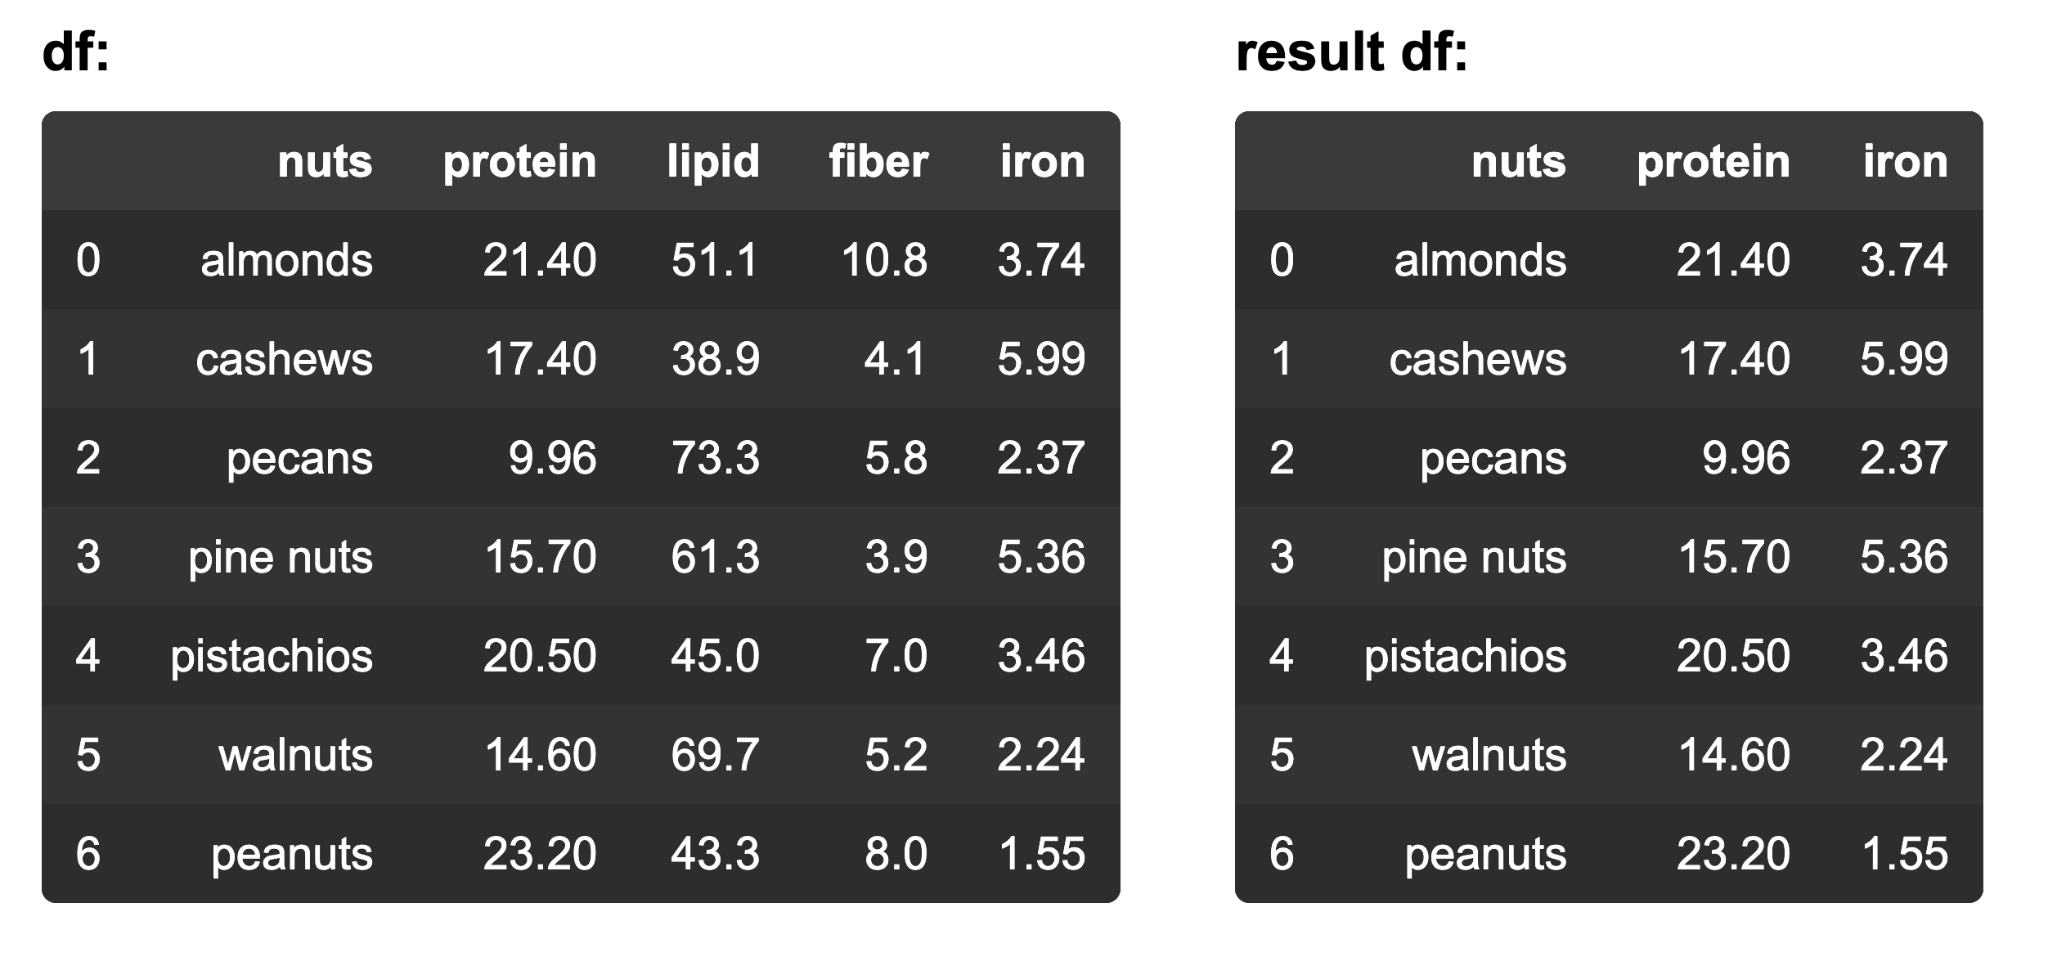
- df = df[[‘nuts’, ‘protein’, ‘iron’]]
- df = df.drop(columns=[‘nuts’, ‘iron, Fe’, ‘protein’])
- df = df[[‘lipid’, ‘fiber’]]
- df = df.drop(columns=[‘lipid’, ‘fiber’])
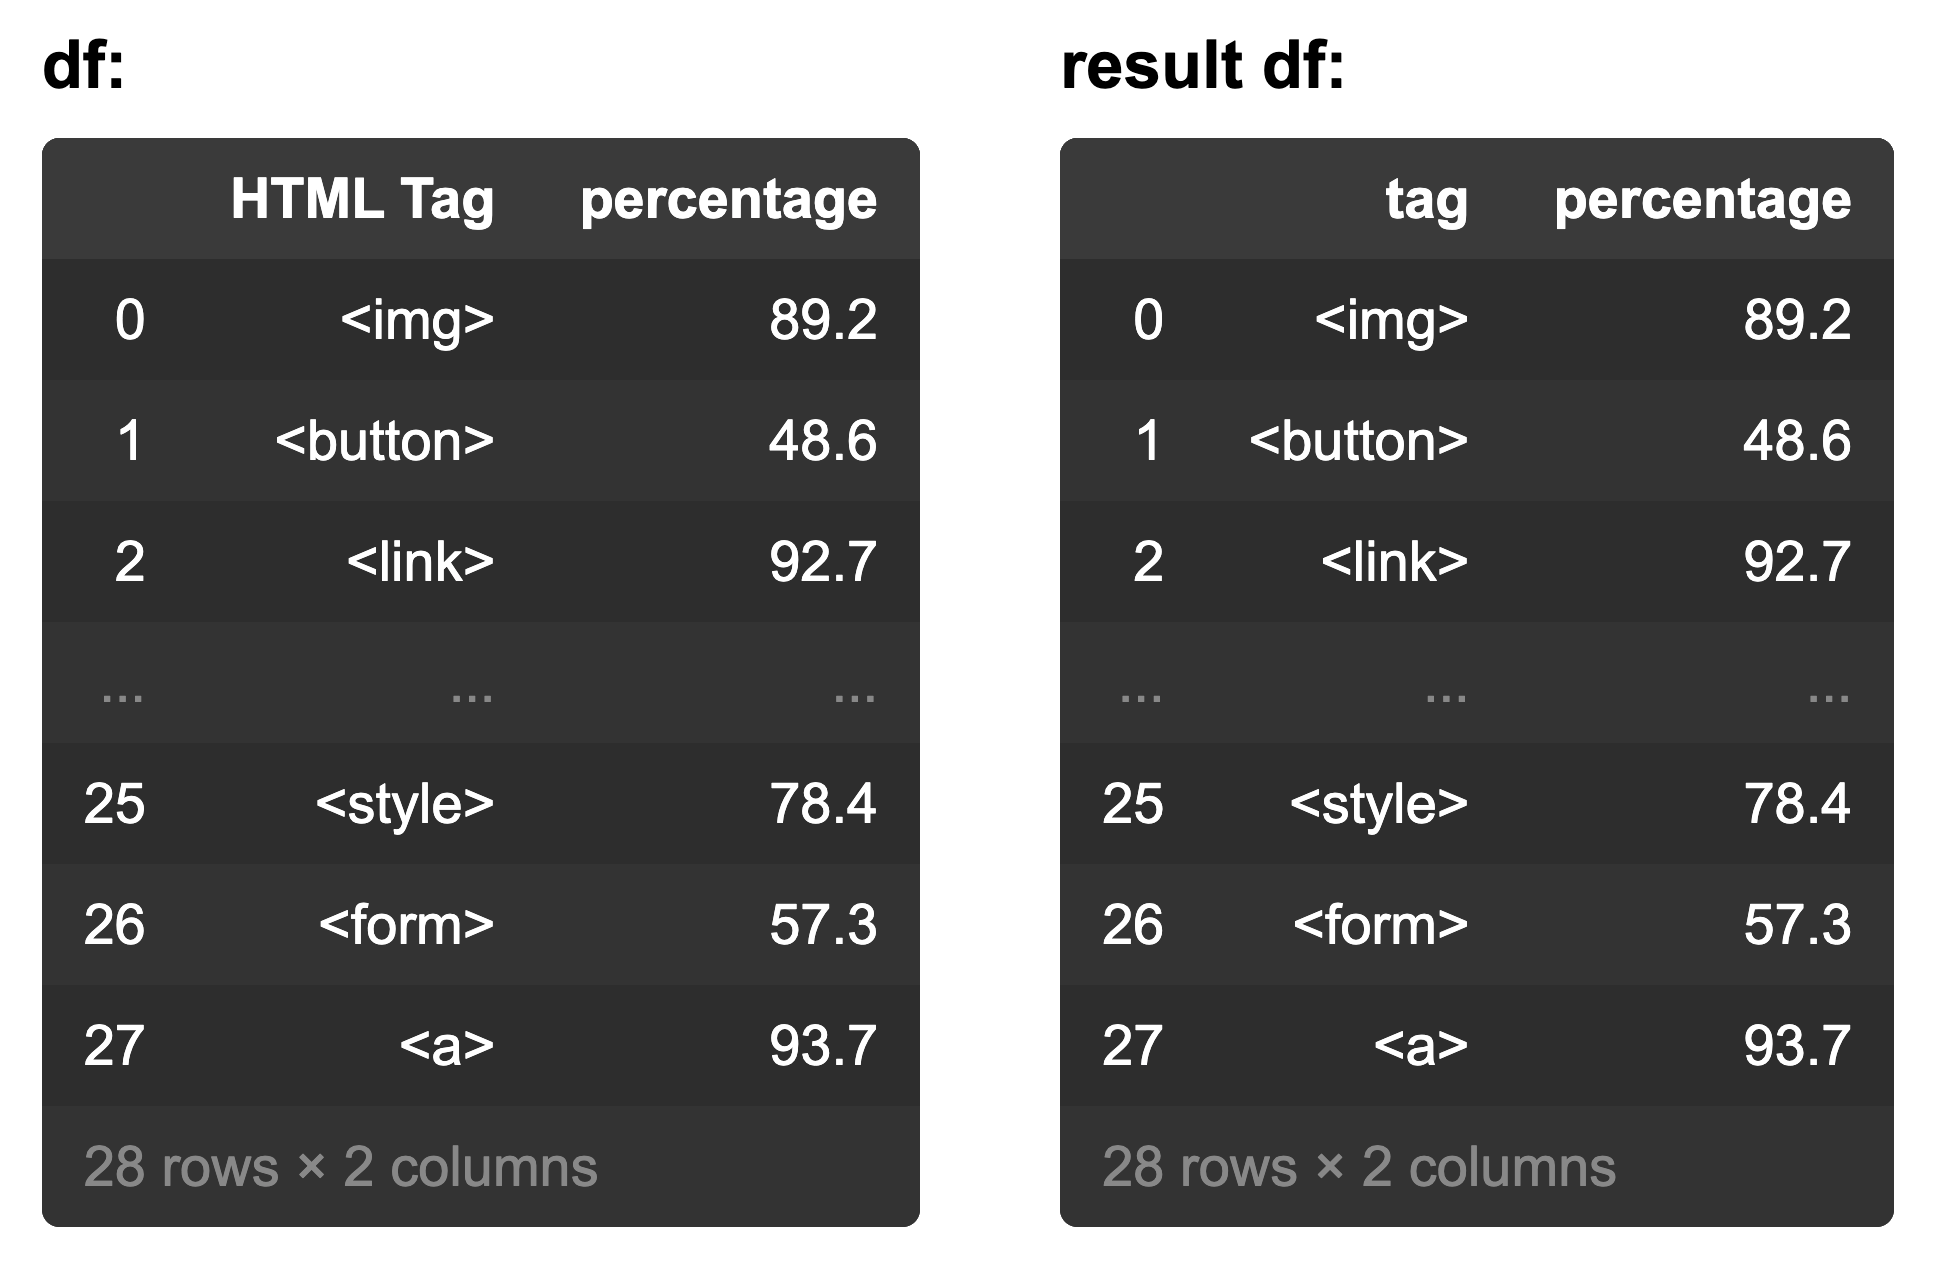
10. The dataframe shows the percentage of webpages that use each html tag. Which code would rename the columns as shown in the results dataframe?
- df.rename(columns={‘HTML Tag’: ‘tag’})
- df.rename(columns={‘tag’: ‘HTML Tag’})
- df.rename(columns=str.title)
- df.rename(columns=str.upper)
11. The graph shows the average amount of daylight per day versus latitude. Which code would label the Arctic circle? The marker is located at (44, 67).
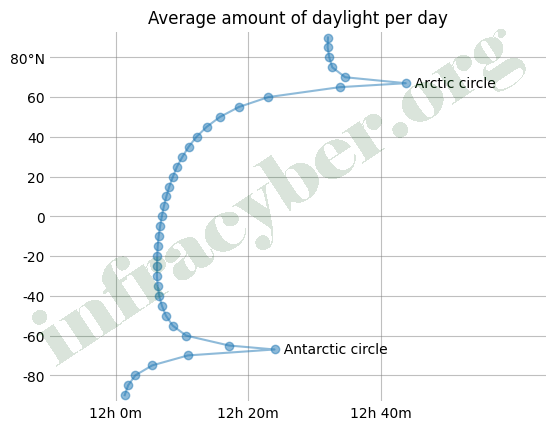
- plt.text(44, 67, ‘ Arctic circle’, va=’right’, ha=’center’)
- plt.text(44, 67, ‘ Arctic circle’, va=’left’, ha=’center’)
- plt.text(44, 67, ‘ Arctic circle’, va=’center’, ha=’left’)
- plt.text(44, 67, ‘ Arctic circle’, va=’center’, ha=’right’)
12. The graph above was made in Matplotlib.pyplot and shows the outcome of 204 penalty kicks in soccer. Which two techniques were used? (choose 2)
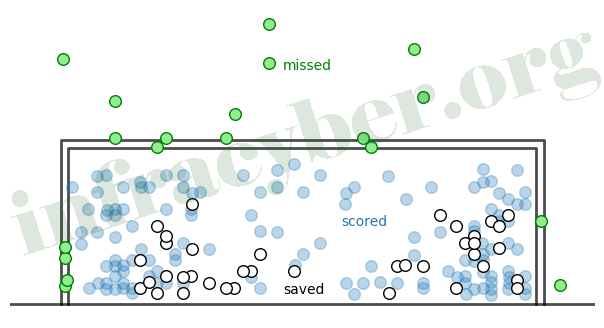
- Sort the data
- ax.set_aspect(1)
- Show equality line
- Show vertical grid lines
- Change marker transparency
13. The dataframe is from ‘soccer-penalty-kick-outcomes.csv’. Which code would return all the penalty kicks that were not misses and were above 4 feet?
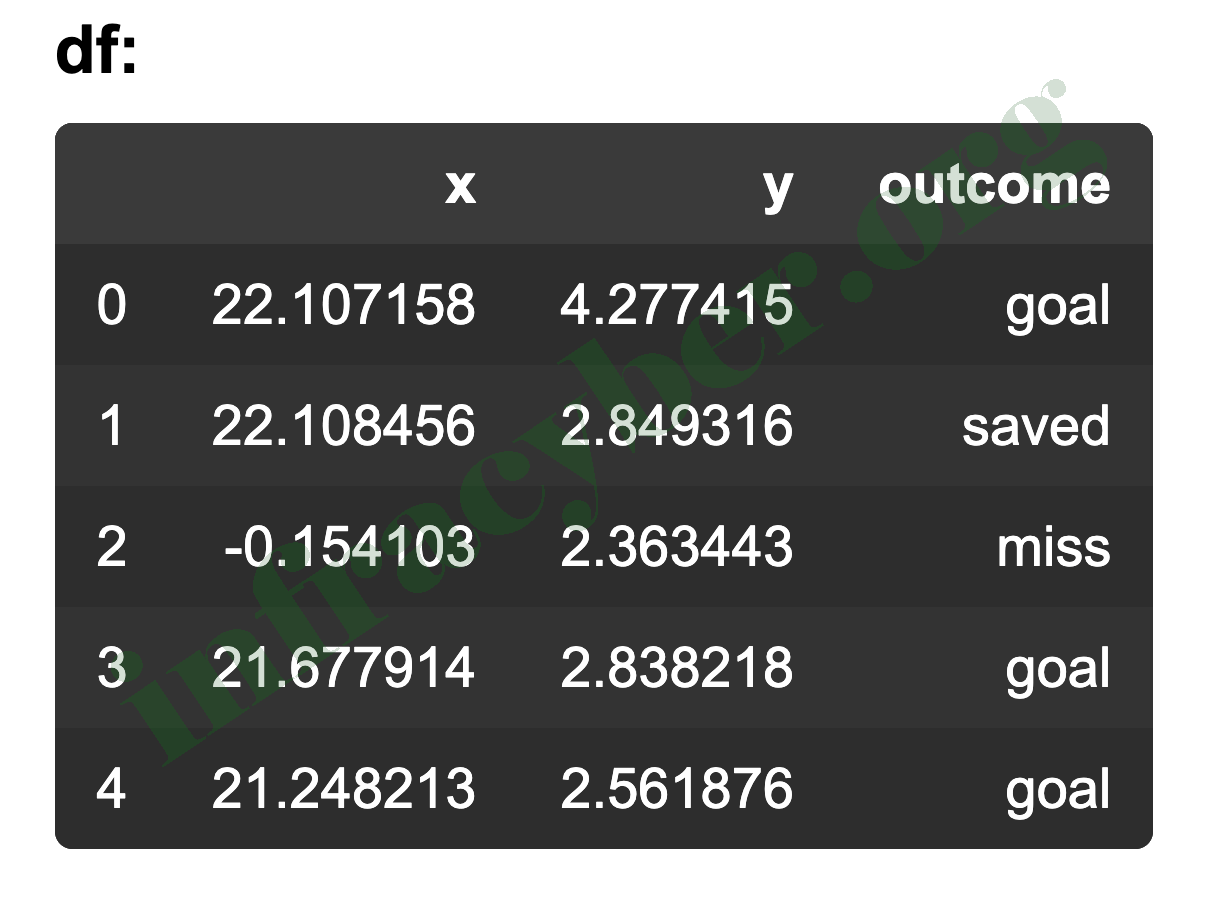
- df.filter(‘outcome == “miss” and y > 4’)
- df.filter(‘outcome != “miss” and y > 4’)
- df.query(‘outcome != “miss” and y > 4’)
- df.query(‘outcome == “miss” and y > 4’)
14. Two people were restricted to three hours of sleep a night for a week. Every day their reaction time was measured. Which two statements are best supported by the data? (choose 2)
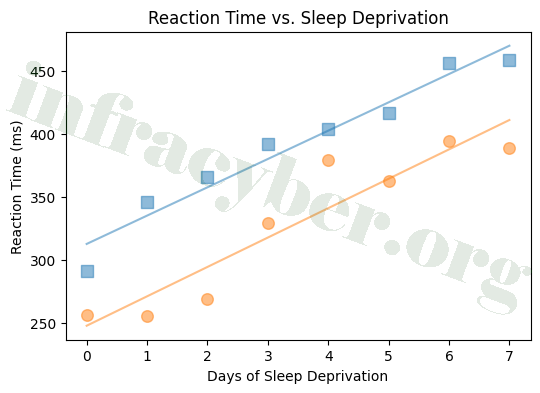
- Both participants show similar slopes.
- The argument that sleep deprivation affects reaction times would be stronger if we only examined one person.
- Reaction time appears to increase as sleep deprivation increases.
- The graph proves that sleep deprivation affects reaction times.
- Both participants show similar y-intercepts.
- Reaction time appears to decrease as sleep deprivation increases.
15. One possible confounding variable in the reaction time vs sleep deprivation study is that participants may have become bored spending a week in the laboratory, which could affect their reaction time. How could researchers deal with confounding variables such as this?
- Introduce engaging activities during the laboratory stay to minimize boredom while maintaining the sleep deprivation protocol.
- Include a control group that stays in the laboratory for the same duration but does not undergo sleep deprivation.
- Shorten the study duration to one day to reduce the potential for boredom to develop.
- Conduct the study in participants’ home environments to eliminate the laboratory setting as a source of boredom.
16. A fraud detection technique, called Benford’s law, analyzes the frequency of the first digit numbers. How was the ‘first_digit’ column calculated from the ‘quantity’ column as shown?
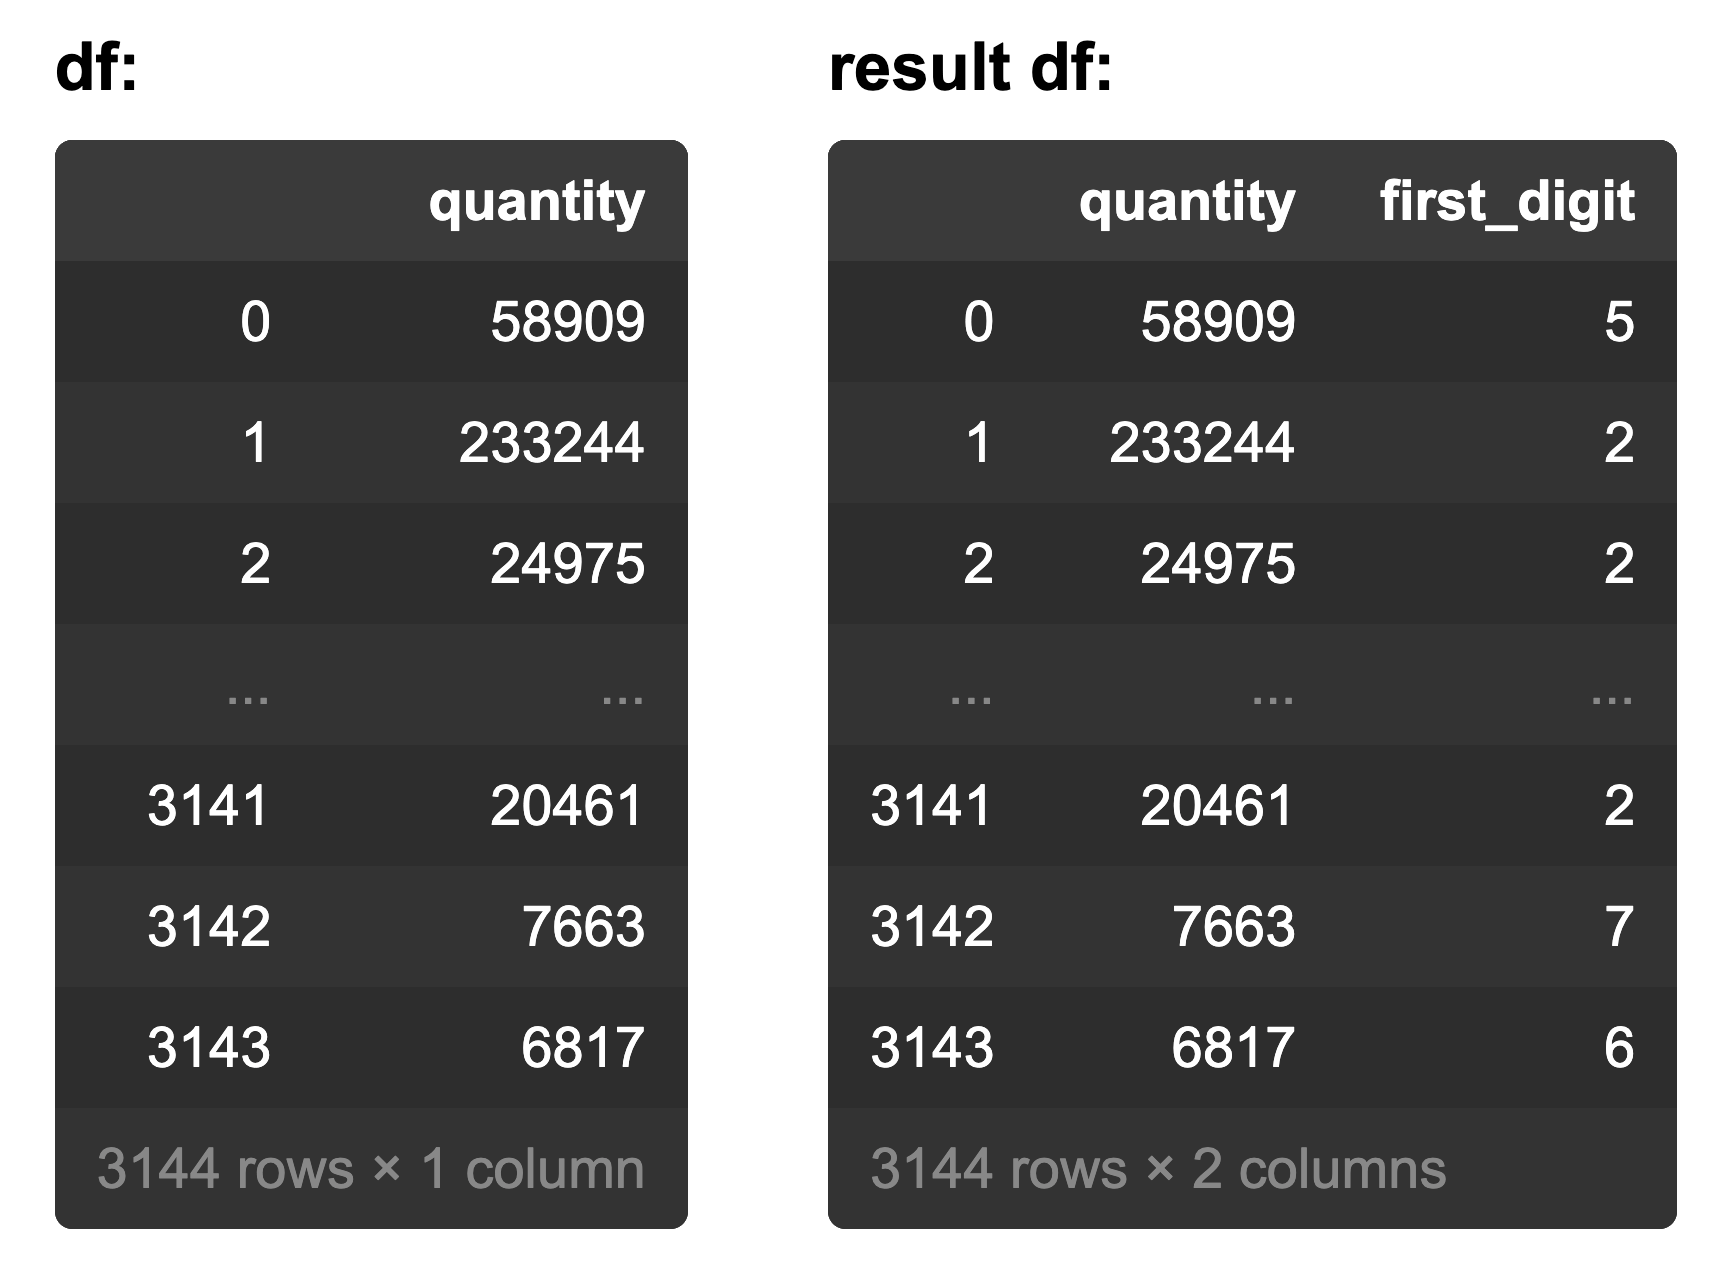
- df[‘first_digit’] = df[‘quantity’] / 10
- df[‘first_digit’] = df[‘quantity’].astype(str).str[1]
- df[‘first_digit’] = df.eval(‘quantity / 10’)
- df[‘first_digit’] = df[‘quantity’].astype(str).str[0]
17. The dataframe is from ‘first-digit-counts.csv’. Which code would create the graph showing the Benford’s law curve?
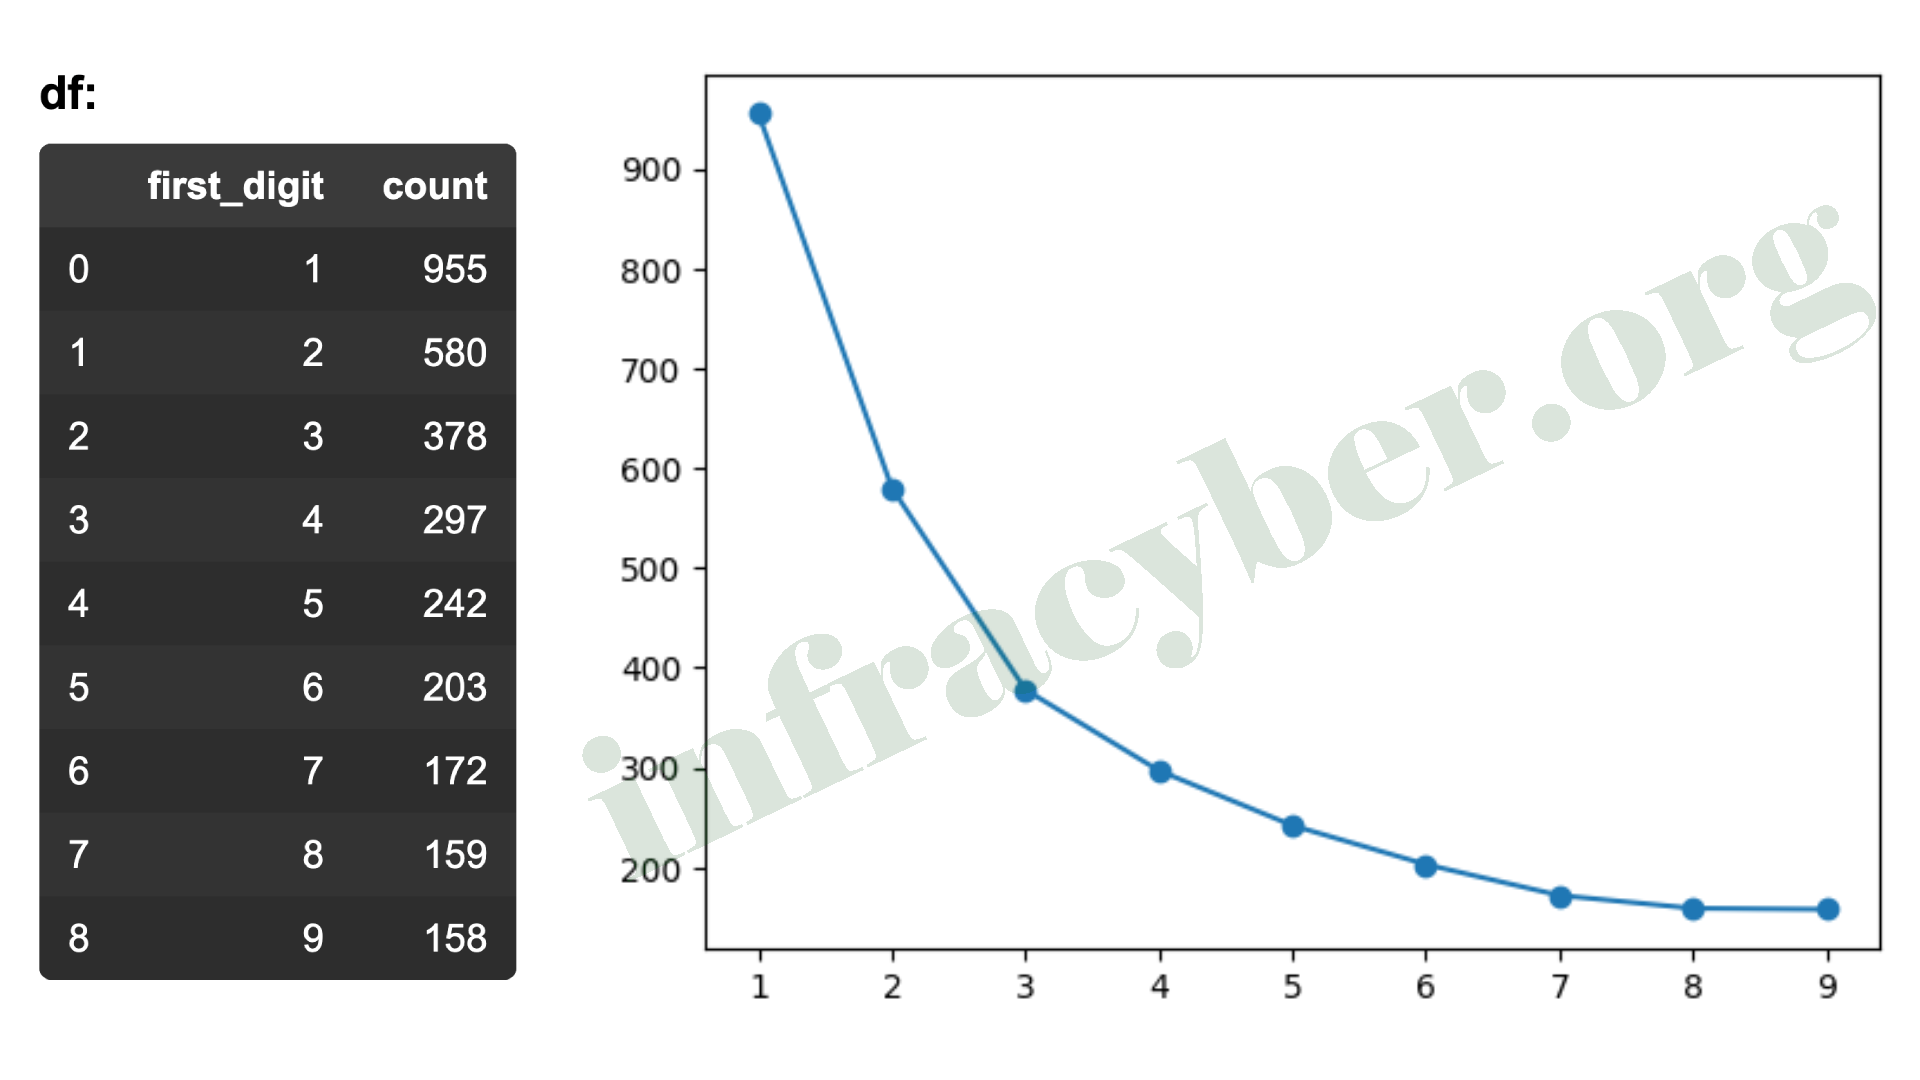
- plt.scatter(df[‘first_digit’], df[‘count’], marker =’^’)
- plt.plot(df[‘first_digit’], df[‘count’], marker =’o’)
- plt.plot(df[‘first_digit’], df[‘count’], marker =’^’)
- plt.scatter(df[‘first_digit’], df[‘count’], marker =’o’)
18. The dataframe comes from ‘monthly-mean-sunspot-number.csv’. The ‘year-month’ column contains string values, ‘datetime’ is a column of datetime objects, and ‘sunspots’ contains float numbers. Which code would produce the graph shown?
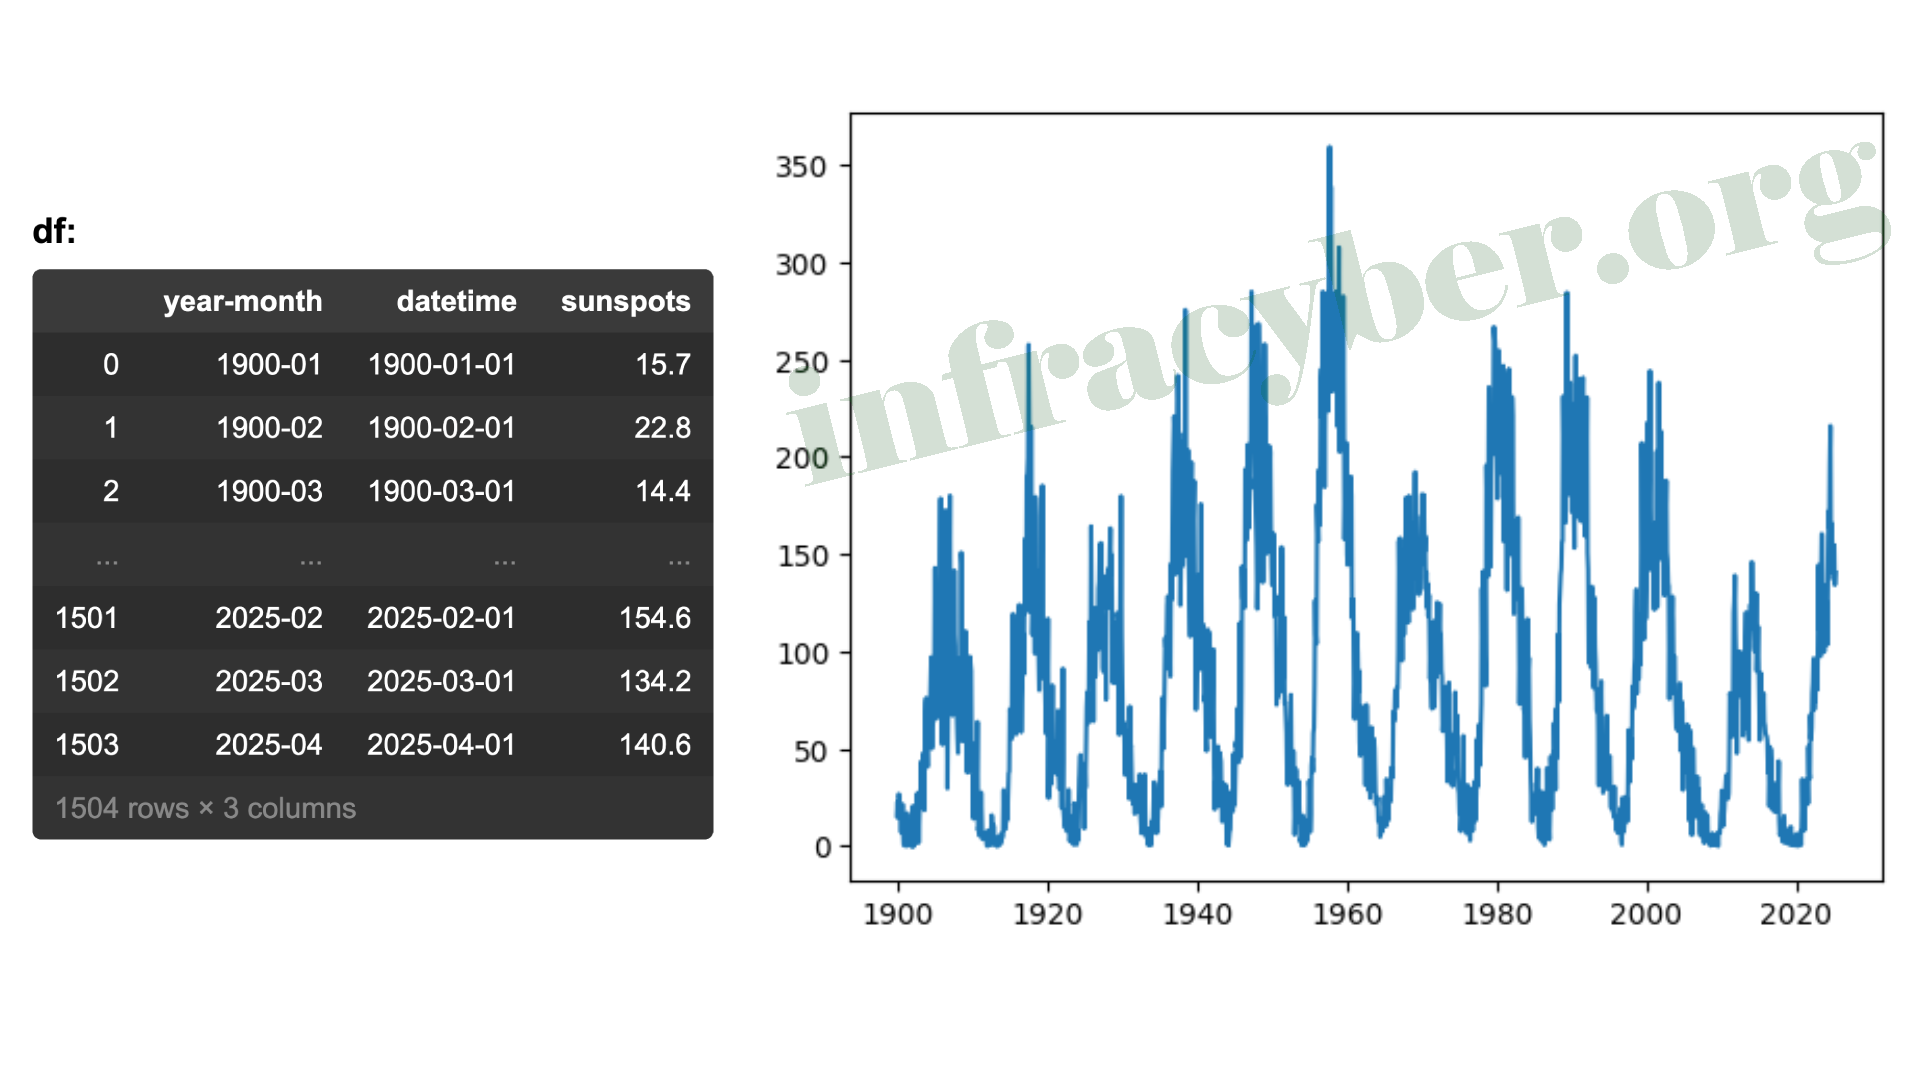
- plt.plot(df[‘year-month’], df[‘sunspots’])
- plt.plot(df[‘datetime’], df[‘sunspots’])
- plt.plot(df[‘sunspots’], df[‘year-month’])
- plt.plot(df[‘sunspots’], df[‘datetime’])
19. The graph shows the number of film and digital cameras sold each year. The iPhone was first launched in 2007 and the Samsung Galaxy in 2009. Which of the following statements are best supported by the graph.
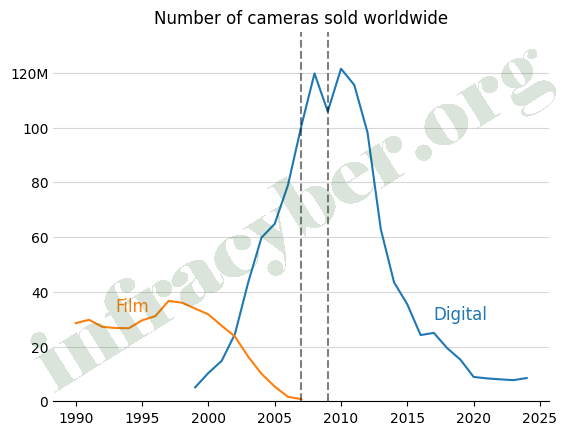
- Digital camera sales peaked before the iPhone was launched in 2007.
- Both film and digital camera sales remained stable from 2005 to 2025, unaffected by the introduction of smartphones.
- The Samsung Galaxy’s launch in 2009 was followed by an immediate drop in film camera sales.
- Film camera sales increased steadily after the launch of the iPhone in 2007.
- Smartphones may have led to a significant decline in digital camera sales after 2010.
20. Which two of the following Pro Tips were followed to create the graph? (choose 2)
- Replace ticks and spines with faded grid lines.
- Reduce rotated text.
- Label the lines.
- Give the bars order.
- Square up the plot.